This paper is available on arxiv under CC 4.0 license.
Authors:
(1) Z. Jennings, Astrophysics Group, Keele University, Staffordshire, ST5 5BG, UK (E-mail: [email protected]);
(2) J. Southworth, Astrophysics Group, Keele University, Staffordshire, ST5 5BG, UK;
(3) K. Pavlovski, Department of Physics, Faculty of Science, University of Zagreb, 10000 Zagreb, Croatia;
(4) T. Van Reeth, Institute of Astronomy, KU Leuven, Celestijnenlaan 200D, B-3001 Leuven, Belgium.
Table of Links
- Abstract and Intro
- Observation
- Orbital Ephemeris
- Radial Velocity Analysis
- Spectral Analysis
- Analysis of the Light Curve
- Physical Properties
- Asteroseismic Analysis
- Discussion
- Conclusion, Data Availability, Acknowledgments, and References
- Appendix A: Ephemeris Determination
- Appendix B: Iteratively Prewhitened Frequencies
- Appendix C: Detected Tidally Perturbed Pulsations
2 OBSERVATIONS
2.1 Photometry
The Kepler space telescope (Koch et al. 2010) was launched in March 2009 with the primary aim of detecting Earth-like extrasolar planets around solar-like stars. However, the mission has also provided a huge amount of high-quality data on stars and stellar systems (Hong et al. 2022). The data were collected using two modes of observation (Gilliland et al. 2010), long cadence (29.5 min sampling rate) and short cadence (58.5 s sampling rate). To keep the ht). solar arrays pointed toward the Sun during its Earth-trailing heliocentric orbit, the spacecraft was rotated by 90◦ every three months (one quarter). Primary functions of the Kepler photometric analysis module of the Kepler science data processing pipeline are responsible for generating the Simple Aperture Photometric (SAP) flux time series of the observed objects, while secondary photometric analysis functions performed by the Pre-Search Data Conditioning (PDC) module support systematic error correction, giving rise to the PDCSAP fluxes (see Jenkins 2017, for further details on the SAP and PDCSAP measurements). KIC 9851944 was observed by Kepler in six quarters (0, 12, 13,


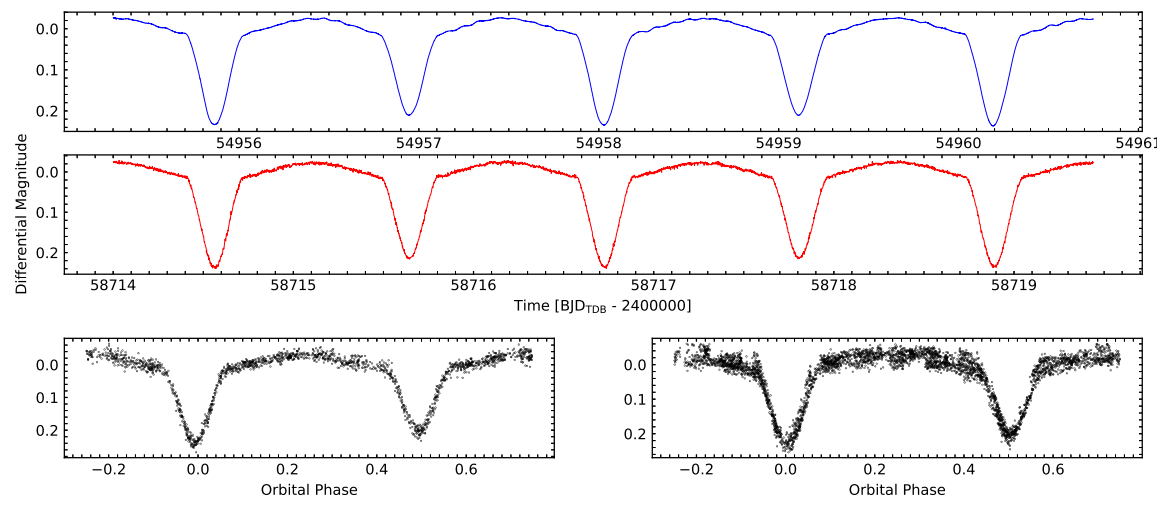
16). The light curves from the Kepler quarters and TESS sectors mentioned above were downloaded from the Mikulski Archive for Space Telescopes (MAST) and are used in Section 3 to determine the ephemeris of the system, as well as Section 6 to obtain the final model of the light curve. Both SAP and PDCSAP measurements are available; the SAP and PDCSAP fluxes were similar, which we verified by inspecting the SAP fluxes with the PDCSAP fluxes overplotted after dividing them by their median flux values to put them on the same scale. Thus, we used the SAP measurements to avoid possible biases due to the additional processing applied to the PDCSAP data. A second-order polynomial was fitted to fluxes that correspond to positions of quadrature, i.e., the maximum of the ellipsoidal brightening, to estimate systematic trends present in the light curves. Subtracting the difference between this polynomial and the median flux of the light curve yields a model for the local median level of out-of-eclipse flux. This model was then divided out to remove systematic trends. The residual value of a smoothed version of the light curve subtracted from the observed light curve was calculated and observed fluxes that deviated by more than 1% were rejected. Fluxes were converted to magnitudes and errors were propagated following Prša (2018). The short cadence Kepler light curve from Quarter 0 and the two-minute cadence TESS light curve from Sector 15, after performing these operations, are shown in the top and middle panels of Fig.1, respectively.
ely. KIC 9851944 was also observed by the Wide Angle Search for Planets (WASP) telescope (Butters et al. 2010) between May 2007 and July 2010. WASP consisted of two robotic observatories, one in the Nothern Hemisphere at Observatorio del Roque de los Muchachos on La Palma and the other at the South African Astronomical Observatory (SAAO), each with eight 20 mm telescopes on a single mount. Observations of KIC 9851944 collected by WASP between May 2007 and July 2007 as well as between June 2008 and July 2008 are shown in the bottom panels of Fig.1 phase folded about the orbital period determined in Section 3. The data collected by WASP for KIC 9851944 were only used to constrain the times of primary minima when performing preliminary fits to the Kepler and TESS light curves in Section 3, to determine the orbital ephemeris.
2.2 Spectroscopy
A set of 33 spectroscopic observations were obtained for the target using the Hamilton échelle spectrograph (Vogt 1987) on the Shane 3 m telescope at Lick Observatory during two observing runs, one in July 2012 and the other in June 2013. The data were obtained using CCD chip no. 4, giving a wavelength coverage of 340 – 900 nm over 89 échelle orders at a resolving power of R ≈ 60000.
The data were reduced using the standard pipeline for the spectrograph (e.g. Fischer et al. 2014). Flat fields were obtained with a quartz lamp and divided from the spectra. The wavelength calibration was obtained from exposures of a thorium-argon emission lamp taken roughly every hour during the night.
Details for the normalization of the one-dimensional extracted spectra are given in Sections 4 and 5 because each of those components of the analysis used different approaches.
Table 1 gives the epochs of each of the 33 spectrosopic observations as well as the signal-to-noise ratio (S/N), estimated as the square root of the counts close to the peak of the best-exposed échelle order. Also given are the corresponding RVs of each component that are derived in Section 4.

